retail sales analysis dashboard
Get complete visibility of product sales performance by store
Now you can take the power of Microsoft D365 FO and PowerBI to harness the data within your organization like never before. Find out more how this works below.
Not everyone in your organization needs access to the same information. Still, whether you’re a Senior Executive, a Merchandiser, or a Store Manager, there is information that will help you make more informed decisions. The problem is getting different groups access to the right information was not possible without complicated code and significant expense. Until now.
What our Retail Sales Analysis Dashboard can do for you?
Overview of Sales Performance Across the Company
Puts the right information in front of the right people, so they have exactly what they need (and nothing they don’t), to make decisions with real-time information hot off the cloud.
Lower Cost because there's No Coding Required
Lower Cost because there's No Coding Required
Thanks to Low-code/No Code Application development, what was once only possible with traditional development is now possible with citizen development
Dashboards can be Customized to Fit Different Team's Needs
Easily sort data like store, product category, day, month, year, quarter or year without needing to wait for IT to do it for you
How the Retail Dashboard can be Leveraged by Role
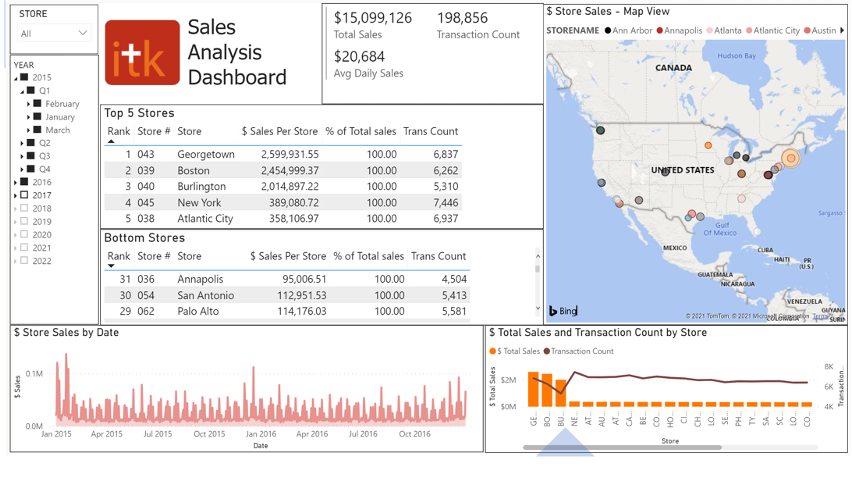
Senior Leadership
- Provides key metrics like sales results, avg daily sales, and sales per location
- Insights into how each store is performing
- Filters to view the data you want to see (dates, stores, regions, categories)
- Easily compare results of nearby stores
- Get only the data you need to make good decisions without getting buried in unnecessary data
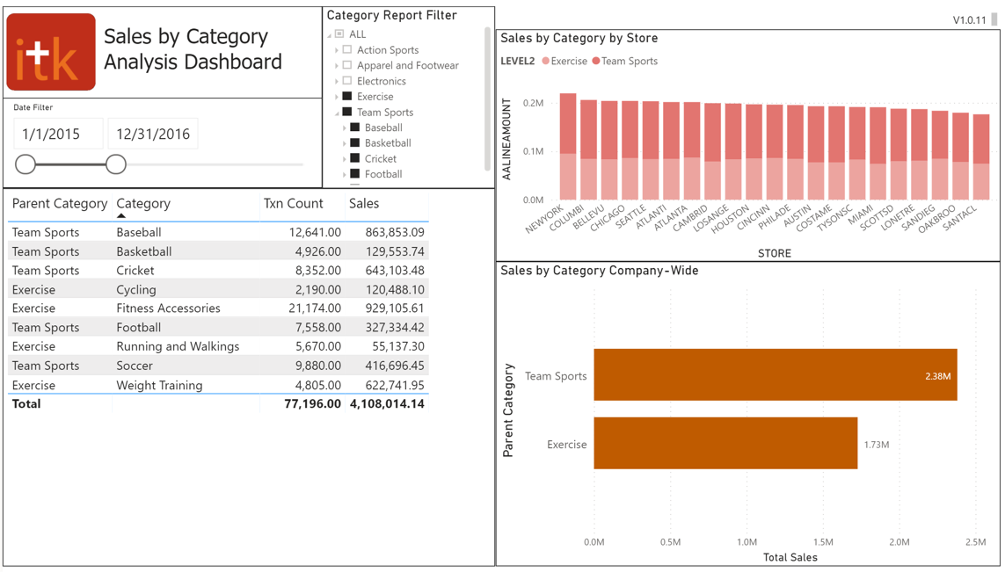
Merchandisers
- Compare item or category specific sales by group of nearby stores, regions, or entire company
- Identify best and weakest performing products by location or category
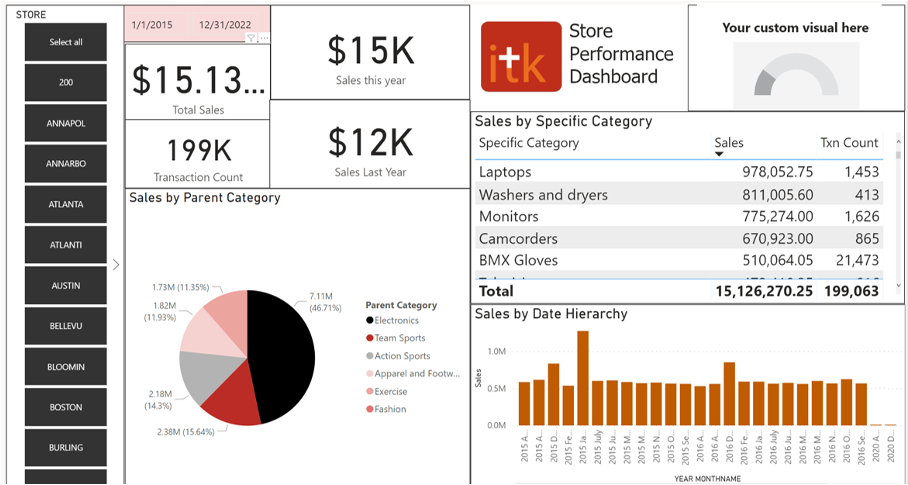
Store Managers
- View data in near real-time data to make actionable decisions to improve store efficiency
- Review important KPI data such as transaction count and average sale
- Drill down into time periods, to compare year over year sales like transaction counts, sales per square foot and product category performance
- See the data that is most useful to running the store day in and out
- Evaluate product sales daily, instead of weekly or monthly
ITK's Retail Sales Analysis Dashboard
Learn how Microsoft D365 + PowerBI makes it easy and cost effective to get custom views with the right info to the right people without custom code.

Your view of you organization's data will never be the same.
Speak with aN expert to find out how we can help you transform how you do business.